
HAYPP Watch: September 2025 & Q3
Haypp looks set for its best quarter ever; I’ll share my Q3 forecast in this report.

For those new here, Haypp Watch is where I track my number one holding, Haypp Group, using web traffic and other data to anticipate earnings before they’re released.
Over the past year, this approach has been accurate enough; about 3% MAPE; to consistently get a read on results ahead of the market.
In this edition, I’ve gone deeper than before: breaking down segment-level estimates, revisiting the ZYN effect, and revealing how I expect the stock to react once Q3 numbers drop.
The question is; does the data point to another strong quarter, or has the rally already priced it all in?
Disclaimer:
This analysis is not financial advice. It’s based primarily on web traffic data, which can be influenced by factors outside the company’s control; such as marketing campaigns, SEO changes, or temporary shifts in consumer behavior.
While web traffic offers useful directional insight, it doesn’t capture everything that drives revenue. Variables like average basket size, currency effects, pricing, and product mix can all materially affect results.
September: On the Rise Again
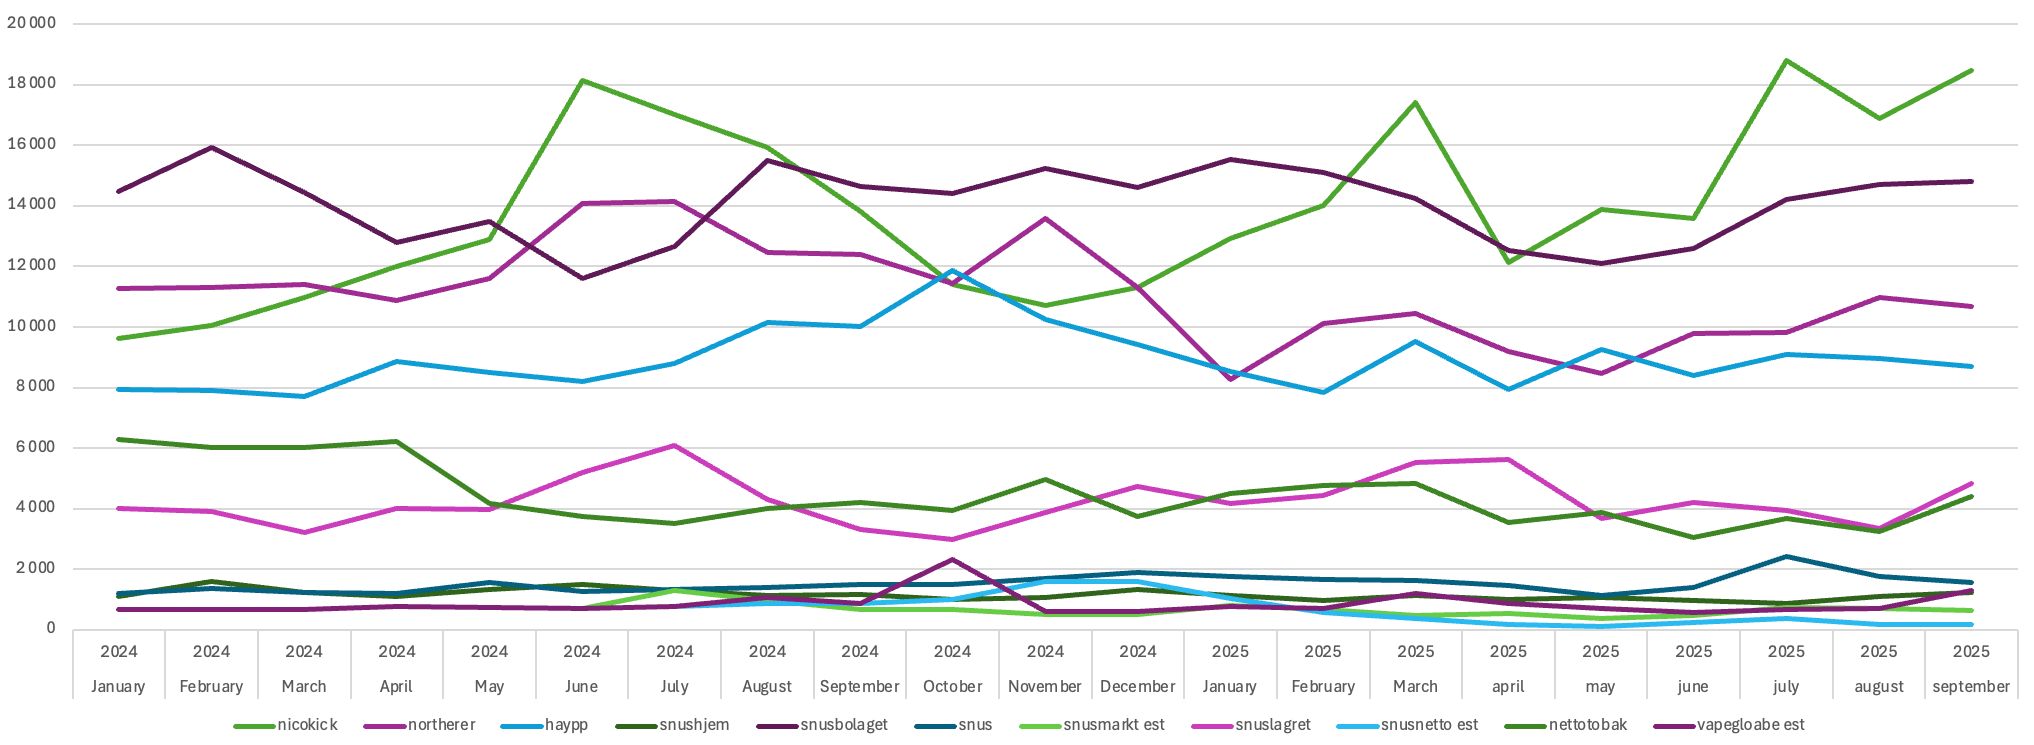
Let’s start by looking at September and how each of Haypp’s sites performed. Below you can see a chart covering all Haypp domains. There’s nothing extreme in the data; more a picture of broad-based strength across markets.
Nicokick is hovering around all-time highs, while Snusbolaget remains stable and clearly above its summer slump. Both Norway and Sweden show continued strength, with smaller sites there performing well. Most interestingly, Vapeglobe saw a large increase in traffic during September.
The key takeaways from the data are:
Nicokick appears to be trending aggressively higher, likely fueled by a renewed ZYN supply,
Northerner remains somewhat muted, suggesting that the ZYN restock is helping but not triggering any sharp spikes, and
The core markets look healthy and strong after a relatively sluggish Q2.
Finally, Vapeglobe’s traffic nearly doubled; albeit from a low base; signaling that this emerging segment is starting to gain real traction.
Looking at Q3 Web Traffic and Events
Looking at Q3 as a whole, this quarter shows the strongest web traffic growth of any period in my dataset ;for better or worse. It makes predicting Q3 results harder, but it also signals a fundamentally stronger quarter. I’ll return to the actual revenue prediction in the next section.
The first thing that stands out in Q3 traffic is the clear surge in the U.S., combined with steady recovery in the core markets, which offsets the slowdown seen in Q2.
Most of the U.S. growth came from Nicokick, while Snusbolaget led the gains in Sweden. The roughly 10% traffic growth across core markets likely reflects mean reversion after the Q2 slump, when Swedish site traffic declined unusually.
In the U.S., growth seems partly driven by the return of ZYN supply, which resumed around the second week of September. However, there’s an interesting twist; traffic began spiking well before the official announcement and availability. This could mean that Haypp’s like-for-like sales are already up strongly, and that the ZYN effect is only starting to show in the data toward the end of Q3.
My working theory is that the ZYN resupply will provide a gradual tailwind over the coming quarters, rather than a single one-time boost.
Next, let’s look at where I think revenue is likely to come in.
My Prediction for Q3
Now for the best part; my revenue prediction.
As mentioned earlier, the aggressive growth in web traffic clearly points toward higher revenue, but it also adds uncertainty. Rapid spikes in traffic often signal a wave of first-time customers, whose basket sizes and buying habits differ from repeat buyers. This can distort the link between traffic and sales.
I used three different methods to estimate Q3 revenue; all based on web traffic but with varying levels of detail:
Simple linear prediction:
Web traffic increased 17,6% QoQ, which gives a revenue estimate of 1,083 MSEK. However, this is likely too high, as much of the growth comes from the U.S., where average basket sizes are smaller. I wouldn’t put too much weight on this figure.Mechanical model estimates:
Using a few more detailed models; OLS regression and time-series regression on derived metrics; I got 958 MSEK and 991 MSEK, respectively. Historically, these mechanical models have performed well, though the extreme swings in web traffic this quarter could reduce their reliability somewhat.Adjusted manual estimate:
Finally, I made my own adjusted prediction, incorporating past behavior during periods of extreme traffic growth and making a few conservative assumptions. This gives a revenue estimate of 953 MSEK. It might be a bit low, but it feels more balanced considering the volatility and mix effects this quarter.
From a YoY perspective, 953 MSEK could indeed be conservative, as last year’s web traffic was almost identical to this year’s, though the revenue per active customer is likely higher now.
In summary, I estimate Q3 revenue in the range of 953–1,083 MSEK, with the final figure likely landing closer to the lower end of that range; this estimate does not account for past prediction error. Taking into account past prediction error, the range would be something like 924 - 1020 MSEK (not a very useful range).
Bonus Prediction
As a small extra, I also ran the time-series regression to estimate revenue by segment. These figures should be taken very cautiously, as this level of granularity is new for me and the model hasn’t been validated yet.