
Haypp Watch: Q4 Revenue Prediction
2025 Q4; Prediction Engine Upgrade and Early Signs of Real Growth

It is once again time to try to predict Haypp Group’s Q4 revenue ahead of the official results announcement. The last time I ran this exercise, in Q3, the estimate deviated by roughly 0,19% from the reported figure. That level of precision is unlikely to be fully repeatable and may partly reflect luck. Still, Haypp Group’s web traffic stands out as unusually high quality for forecasting quarterly revenue, often with uncomfortable accuracy.
For those new here, Haypp Watch is a recurring series where I track Haypp Group’s web traffic; the number of users browsing Haypp Group’s websites. I then apply different methods to translate that traffic into revenue estimates ahead of reported results, with the aim of identifying potential alpha.
For those who have been following the series, it has been a while since the last update. That is mainly because there has been little portfolio activity on my side and limited Haypp specific news worth covering. That said, the lack of published updates does not mean inactivity. Over this period, I have continued refining and stress testing my revenue prediction framework.
In this edition of Haypp Watch, I introduce a new approach to estimating Haypp Group’s revenue that should materially improve regional accuracy, particularly in a quarter where underlying growth signals appear unusually noisy.
Disclaimer
This is not financial advice. The methods used in this analysis are experimental and rely on a limited historical dataset. Web traffic–based modeling has clear limitations, particularly during periods affected by supply disruptions and regulatory changes. Forecasting results should therefore be interpreted as directional signals rather than precise predictions, and they may change as new information becomes available.
Backdrop
Q4 is a somewhat unique quarter for Haypp Group, with several forces moving in different directions at the same time.
First, ZYN is back in the US. Management has previously indicated that a return of ZYN availability could be associated with revenue increases of up to 60% in the US segment. At the same time, US web traffic does not reflect anything close to a 60% surge. Traffic to Nicokick and Northerner remains solid, but the rebound appears more muted than one might expect if volume growth alone were driving results. This suggests that part of the recovery may be occurring through changes in order behavior rather than pure user growth.
In the core markets, a different story is unfolding. Sweden is showing very strong momentum in web traffic. Snusbolaget continues to march ahead, and the other core sites are also performing well. Here, traffic growth appears broad based rather than concentrated in a single brand or channel.
The emerging segment also shows healthy momentum. While smaller in absolute terms, traffic trends across these markets are directionally positive and contribute to the overall growth picture.
Taken together, Q4 presents a mixed but interesting setup. Strong core and emerging market traffic contrasts with a US recovery that seems to be driven by factors other than headline traffic growth alone. Below is an overview of web traffic performance across the main sites and regions.
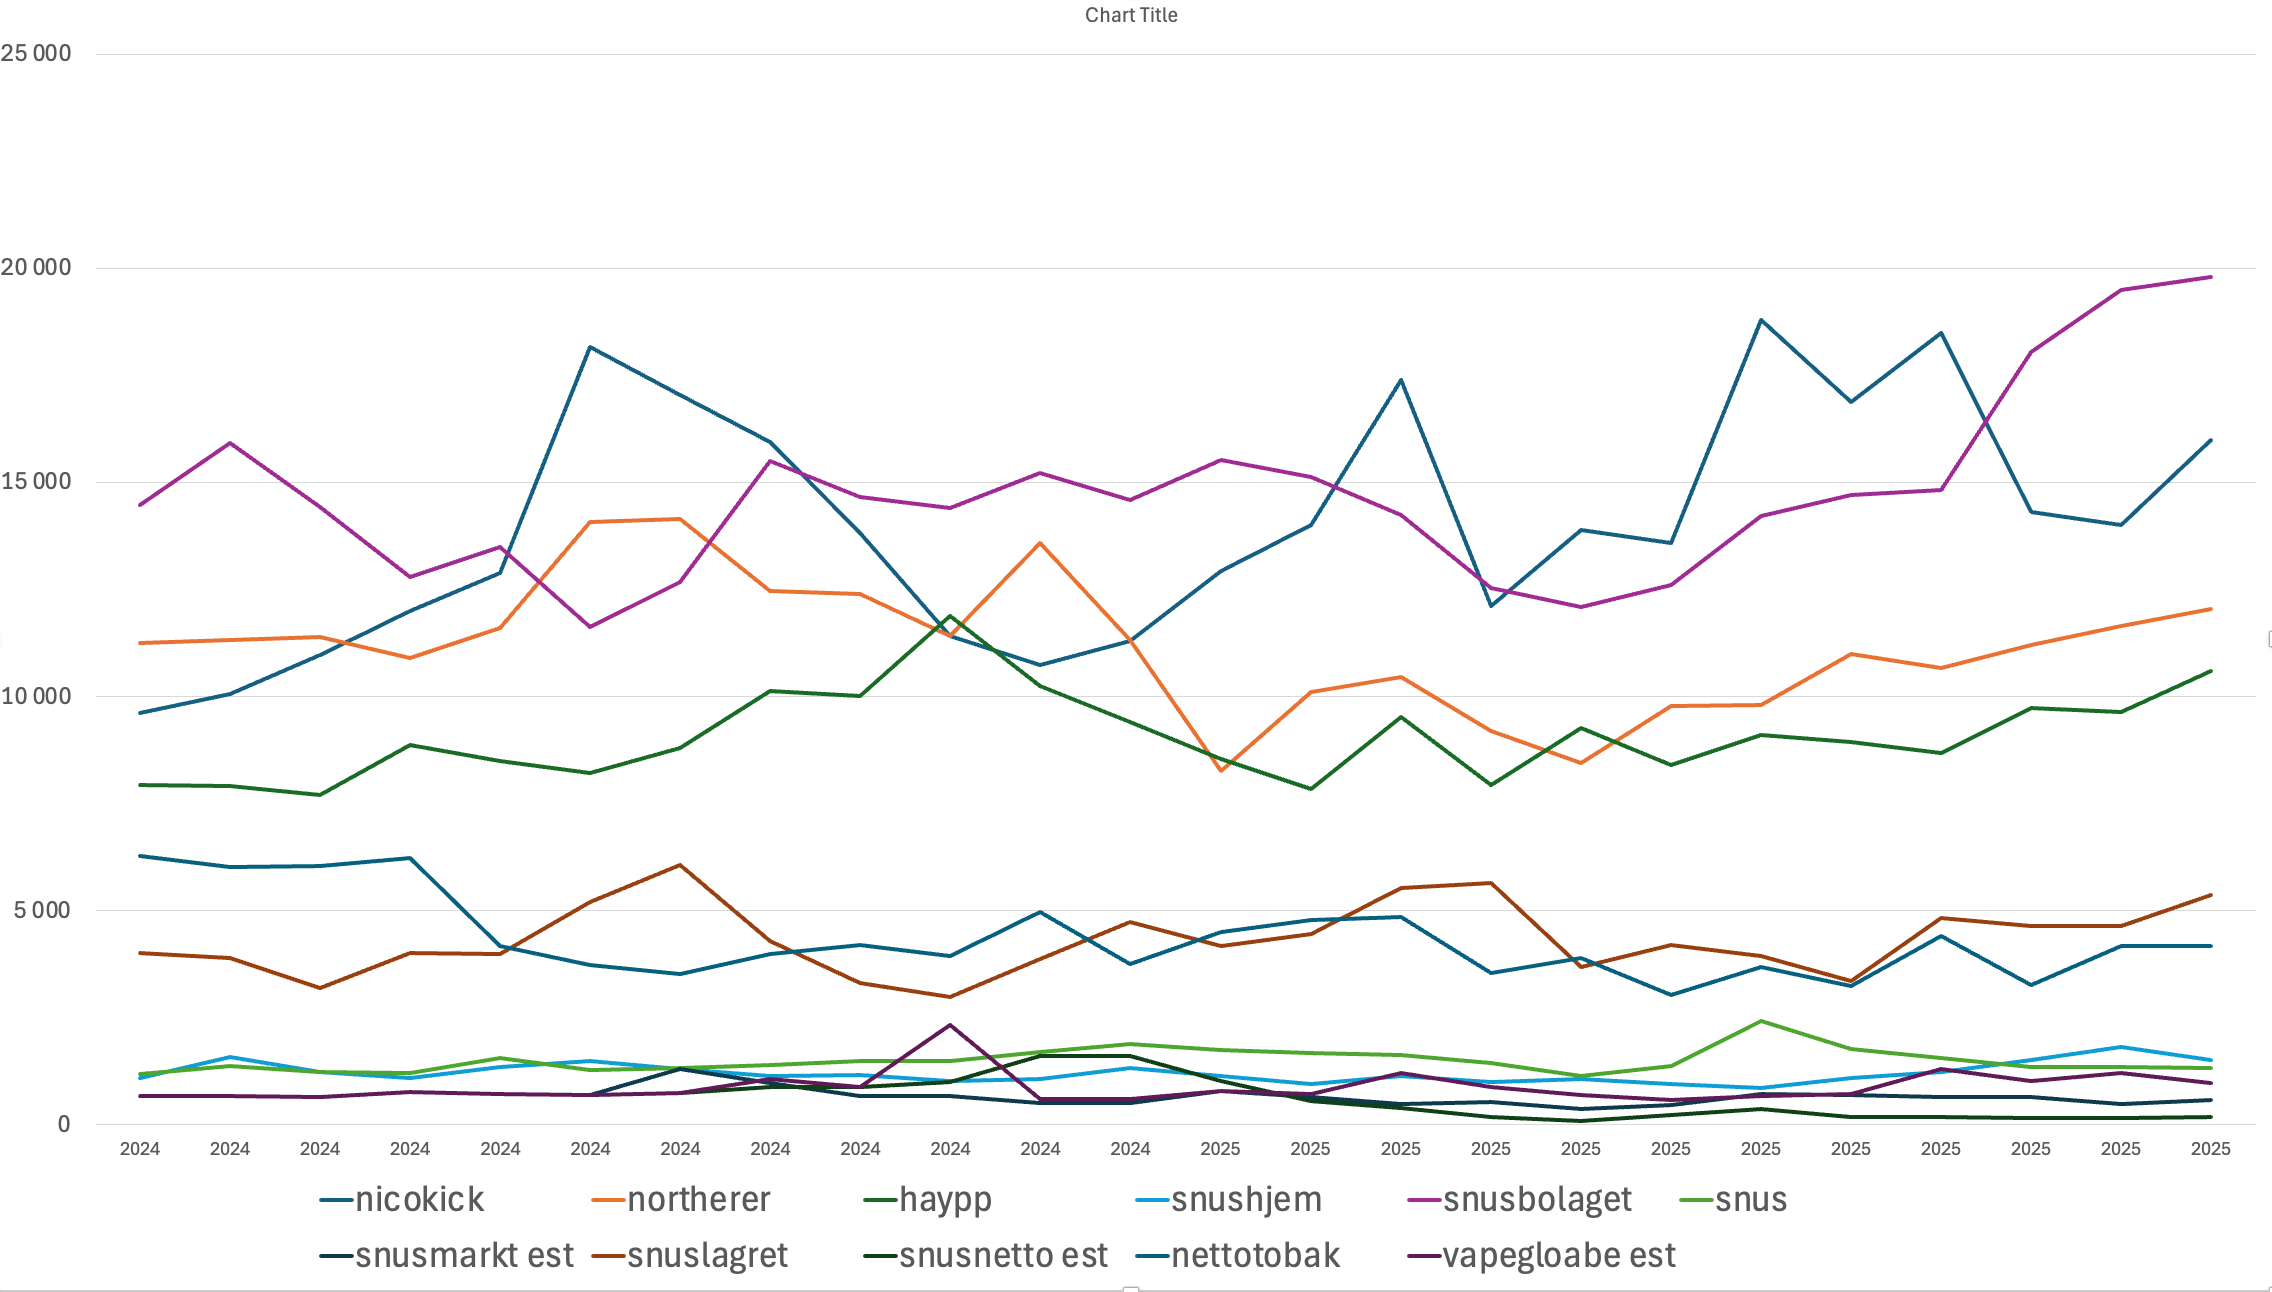
As you can see from the chart, which starts in Q1 2024, Nicokick’s traffic peaked just before Q4, roughly at the same time as ZYN came back online. That peak was followed by a noticeable decline in the subsequent months, and only recently has traffic recovered back toward late Q3 levels. This pattern is difficult to square with intuition. Management has pointed to a potential 60% uplift associated with ZYN in the US, while the traffic data instead suggests something closer to a roughly 25% decline versus peak levels.
At the same time, the chart highlights the clean and persistent growth of Snusbolaget, alongside strong performance across almost all other sites. The contrast between the US and the core markets is hard to ignore.
In summary, the overall setup looks constructive. Core market growth is unusually strong, roughly 15,6% QoQ, and emerging markets continue to show positive momentum. However, the US data contains a clear anomaly, and the strength of the core markets is also unusually pronounced. Together, these dynamics make Q4 revenue meaningfully harder to predict than usual.
Fortunately, the modeling framework has improved as well. In the next section, I will walk through two new models, explain how they work, and show what they are indicating for Q4.
From a simple Excel model to a more structured ML approach
Previously, I modeled Haypp Group using a very simple Excel setup. I calculated historical value per visitor for each reporting segment, applied a basic linear fit, and then adjusted the assumptions based on backtesting and my own understanding of the business. That approach worked reasonably well at the total level, but it consistently struggled when it came to segment-level accuracy. Small changes in assumptions could move large amounts of revenue between Core, Growth, and Emerging, even when the total stayed roughly right.
To improve this, I decided to add more structure and discipline to the forecasting process. The goal was not to replace judgment, but to build a model that could systematically spot and quantify trends, regime shifts, and asymmetries in the data; especially ones that are easy to miss when reasoning manually.
Below is a high-level overview of how the model works.
The core idea: revenue as traffic × monetization
Rather than predicting revenue directly, the model is built around a simple identity:
Revenue = Web traffic × Value per visitor (VPV)
Web traffic is observable and relatively stable at the quarterly level. What actually varies, and what drives forecasting error, is value per visitor; a compact way of capturing pricing, conversion, product mix, promotions, and supply conditions.
The model’s task is therefore to estimate how VPV evolves over time for each segment, given observed traffic dynamics.
What the model is trained to learn
The model uses historical quarterly data for Haypp Group’s Core, Growth, and Emerging segments. For each segment, it observes:
Web traffic levels and changes
Revenue levels and changes
How VPV behaved following different traffic patterns
From this, it learns a small number of disciplined relationships.
First, VPV is assumed to be slow-moving.
In ecommerce, monetization rarely changes abruptly without a structural reason. The model therefore expects VPV to remain close to recent levels and to mean-revert after unusually strong or weak quarters.
Second, traffic growth and VPV interact asymmetrically.
The model distinguishes between normal growth, rapid acceleration, and traffic declines. It allows for the possibility that:
Very strong traffic growth can dilute VPV if it comes from lower-quality demand or promotional activity
Traffic declines do not necessarily hurt VPV, and in some cases can even improve it as marginal demand falls away
This is particularly relevant for Haypp, where Growth and Emerging markets often scale differently from mature Core markets.
Third, segments are treated as related, not independent.
Each segment has its own baseline level of VPV, but the model avoids treating small segments as completely standalone businesses. Differences are allowed, but they are constrained, reflecting the shared ecommerce mechanics across regions.
How the forecast is produced
The forecasting process works in three steps:
Estimate VPV for the forecast quarter based on historical behavior, recent trends, and current traffic dynamics
Use known web traffic for the quarter
Calculate revenue mechanically as VPV multiplied by traffic
This separation is important. It prevents the model from implicitly assuming future revenue growth by accident and forces all assumptions to flow through VPV.
Why this approach adds value
Compared to a manual Excel model, this approach adds value in two ways.
First, it enforces consistency. The same logic is applied across segments and quarters, reducing the risk of narrative-driven adjustments.
Second, it helps surface subtle patterns; such as asymmetric behavior during strong growth or contractions; that are easy to underestimate when reasoning manually.
The model does not replace judgment. It formalizes it. And in doing so, it improves segment-level forecasts while keeping total revenue anchored to observable reality.
V2 ML: adding granularity (and risking overfitting)
After completing the first ML model, I did the only logical thing and built a V2 version. The explicit risk was overfitting. The explicit goal was to see whether adding more structure and more granular data would genuinely improve segment-level understanding, or simply create the illusion of precision.
The key difference in V2 is that it moves one level deeper into the data.
The main change: from segments to individual websites
In the first model, web traffic was aggregated at the segment level. In V2, I instead used monthly traffic data for individual Haypp websites and then rebuilt each segment from the bottom up.
This allowed the model to observe not just how much traffic a segment received, but where that traffic came from.
For each segment and quarter, the model could now see:
Which sites dominated traffic
How concentrated traffic was
Whether growth was broad-based or driven by a single website
Whether traffic shifts were gradual or abrupt
This matters because changes in monetization often come from mix shifts, not from changes in customer behavior at a single site.
New signals introduced in V2
Using site-level data made it possible to add several new inputs that did not exist in V1.
Traffic concentration and mix
The model measures how concentrated traffic is within each segment. A quarter dominated by one large site behaves differently from a quarter where traffic is evenly distributed across many sites.
Dispersion and internal stress
By looking at how uneven growth is across sites, the model can detect whether a segment is healthy overall or whether weakness is being masked by a few strong performers.
Consistency checks
The model also compares traffic aggregated from individual sites to reported segment-level traffic. When these diverge, it acts as a warning that part of the signal may be measurement noise rather than real business change.
What V2 tries to learn that V1 cannot
V1 assumes that a segment is internally homogeneous. V2 explicitly challenges that assumption.
V2 asks questions like:
Does VPV change when traffic becomes more concentrated?
Do segments monetize differently when growth is driven by newer or weaker sites?
Do sharp mix shifts explain quarters where VPV behaves unexpectedly?
In theory, this should allow the model to explain more subtle behavior, especially in Growth and Emerging segments.
Why V2 is more fragile
Despite being more sophisticated, V2 is also more dangerous.
The underlying revenue data is still quarterly and still aggregated at the segment level. Adding many site-level features increases the number of degrees of freedom without increasing the number of revenue observations.
That creates two risks:
Real signals can be drowned out by measurement noise
The model can learn patterns that exist only because of temporary traffic fluctuations or tracking inconsistencies
In other words, V2 can explain the past more easily, but that does not automatically mean it predicts the future better.
How V2 should be used
V2 is not a replacement for the simpler model.
Instead, it works best as a stress-testing tool:
When V2 agrees with V1, confidence increases
When V2 disagrees, the disagreement itself becomes the insight
Large differences often point to mix shifts, data quality issues, or segment-specific dynamics that deserve closer inspection.
What the Market Thinks
Before presenting my own results, it is useful to look at expectations from elsewhere.
On December 29, I ran a public poll on X asking what Haypp Group is expected to report for Q4 revenue. The poll was open for three days. While it is not a formal forecast, it provides a rough indication of where expectations currently sit.
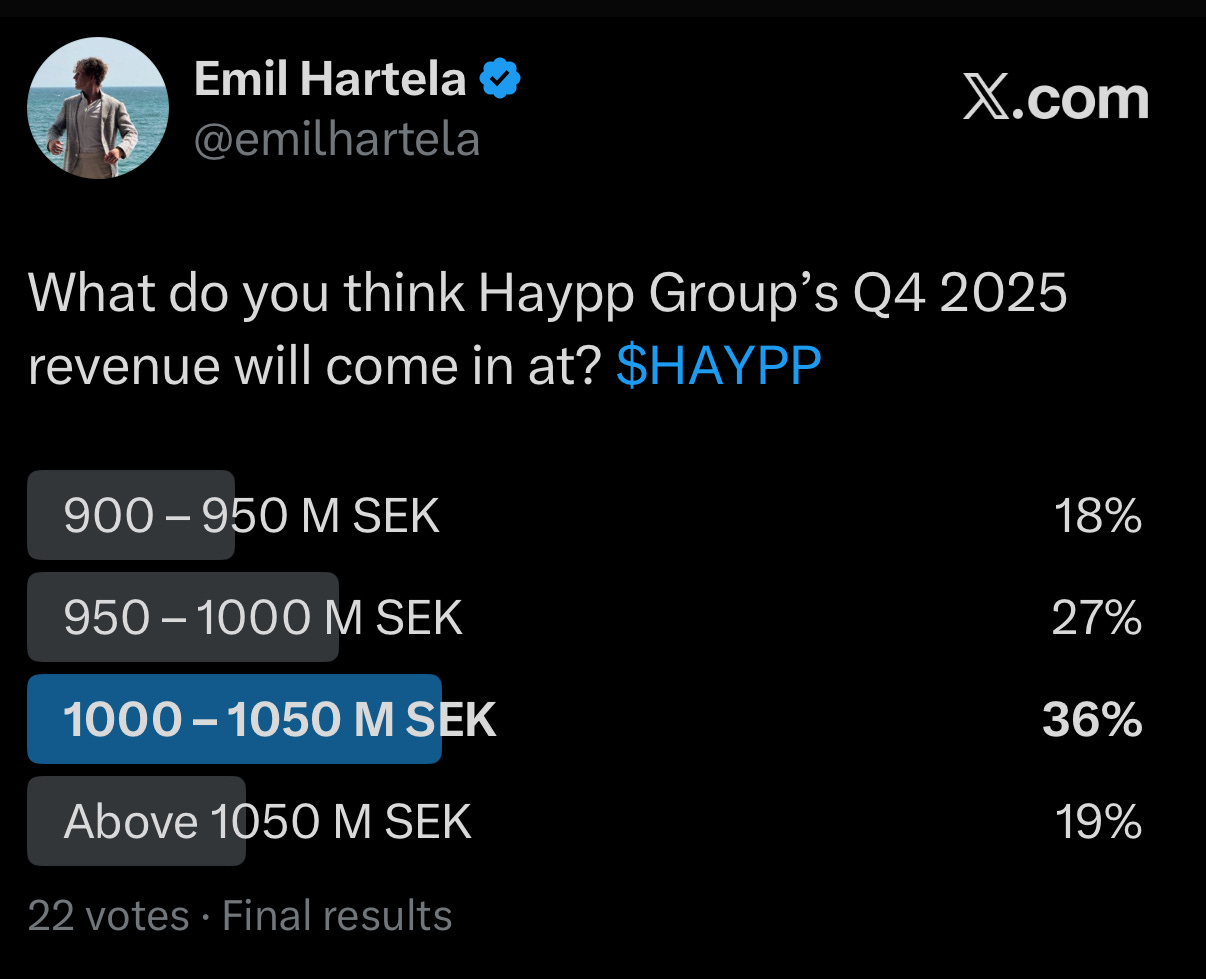
Based on the distribution of responses across the revenue ranges, the implied expected value from the poll is around 1,003 MSEK, with most votes clustered in the 1,000–1,050 MSEK range.
It is worth noting that these polls have produced mixed results in the past. In the previous quarter, the poll outcome was very close to the reported number. In Q2, however, the poll expectation was materially higher than my own estimate. That quarter ended up missing those expectations, and Haypp’s share price fell by roughly 20% in the months that followed.
This contrast is one of the reasons I continue to rely on web-traffic-based analysis. While far from perfect, it has occasionally highlighted downside risk that consensus-style expectations failed to capture. In the next section, I compare the poll-implied expectation with the outputs from my updated models.
Core Market Prediction
Starting with the core markets, the three approaches again converge within a relatively narrow range.
My hand-built estimate comes in at 754 872 300 SEK. This reflects a cautious but constructive view of core market monetisation, assuming that strong traffic growth translates into revenue without extrapolating any temporary uplift too aggressively. Given the volatility seen in web traffic during the quarter, this outcome appears reasonable and internally consistent.
ML Model 1 estimates core revenue at 756 726 642 SEK, almost exactly in line with my own number. This is not surprising. ML1 enforces mean reversion and relies heavily on historical segment-level behaviour, which makes it structurally conservative during periods of accelerating growth. The close alignment between ML1 and my estimate suggests that recent core performance does not yet justify assuming a step-change in value per visitor.
ML Model 2 produces a somewhat higher estimate of 767 194 142 SEK. Unlike ML1, this model is less restrictive and allows recent dynamics to persist for longer. As a result, it represents a more optimistic core scenario, implicitly assuming that monetisation quality held up better than historical averages despite traffic volatility.
Although all three approaches converge closely, there is still reason for caution. The sharp increase in core market traffic during the quarter almost certainly comes with some degree of customer value dilution, whether through promotions, mix effects, or lower marginal conversion. These second-order effects are difficult to capture in backtesting and may only become visible with a lag. As a result, while the core market outlook appears robust, the risk around value per visitor should not be underestimated.