
Haypp Watch: Q1 Revenue Prediction
2026 Q1; Growth Continues Beyond the Breakout

It is once again time to try to predict Haypp Group’s Q1 revenue ahead of the official results announcement. The last time I ran this exercise, the estimate came in extremely close to the reported figure, continuing what has now become a surprisingly strong run of forecasting accuracy. That kind of precision will never be guaranteed, and some variation is inevitable, but the broader point remains intact: Haypp Group’s web traffic continues to be one of the most useful and unusually high quality signals I have found for anticipating quarterly revenue.
For those new here, Haypp Watch is a recurring series where I track Haypp Group’s web traffic; the number of users browsing Haypp Group’s websites. I then apply different methods to translate that traffic into revenue estimates ahead of reported results, with the aim of identifying potential alpha.
For those who have followed the series for a while, there has been a longer gap since the last update. That is not because the work has stopped. Quite the opposite. Behind the scenes, I have continued refining the prediction engine, testing new ways to improve regional accuracy, and strengthening the overall revenue estimation pipeline. A meaningful part of that work has gone into making the framework more robust in quarters where the underlying signals are noisier and less straightforward to interpret.
At the same time, I have also been exploring how this pipeline can eventually be scaled beyond Haypp Group and applied to other companies where web traffic has similar predictive value. That part of the work is still developing, but the ambition is clear: to build a broader framework that can identify useful signals across a wider set of businesses.
And on that note, I would love to hear from readers: if there are other stocks you would like to see covered in the future, comment them at the end of the blog.
Disclaimer
This is not financial advice. The methods used in this analysis are experimental and rely on a limited historical dataset. Web traffic–based modeling has clear limitations, particularly during periods affected by supply disruptions and regulatory changes. Forecasting results should therefore be interpreted as directional signals rather than precise predictions, and they may change as new information becomes available.
Backdrop
Q1 is shaping up to be another interesting quarter for Haypp Group, although for different reasons than in Q4. The broad picture is still constructive. Total tracked daily traffic across Haypp Group’s main sites remained strong in Q1 and came in modestly above the Q4 average. That may not sound dramatic on its own, but it matters in the context of what sits underneath the headline number: several of Haypp’s most important properties continued to perform well, and the US recovery story appears to be extending into the new quarter.
The most important development is once again the US. Nicokick remained at a high level throughout the quarter and averaged clearly above Q4, while Northerner also showed notable strength toward the end of the period, including some very strong weekly readings. That matters because the return of ZYN likely did not fully flow through in Q4. A continued normalization of product availability should still support customer inflows in Q1, especially as former users gradually return to the category rather than all reappearing immediately in one quarter. In other words, the US tailwind likely did not end with Q4. It may still be building.
Outside the US, the picture remains healthy across most of the core business. Sweden continues to look strong, with Snusbolaget still operating at a very high level and Snuslagret also showing solid improvement versus Q4. Haypp’s multi market site performed well too, adding to the impression that demand remains firm across the broader platform. Norway was somewhat more mixed, but still directionally positive overall, with both Snus and Snushjem holding up reasonably well.
The emerging segment is where the picture becomes more complicated. On the one hand, some of the smaller sites still show decent activity. On the other, Haypp Group has wound down its UK vape division, which will likely create a drag on reported revenue from that part of the segment regardless of what parts of the traffic data may suggest. That makes emerging market traffic less clean as a forecasting signal this quarter than usual.
Taken together, Q1 looks like a quarter where the core growth story remains intact. Traffic strength has been broad enough to support another good quarter, and the US segment still appears to have more room to benefit from the return of ZYN. At the same time, the quarter is not perfectly clean from a modeling perspective. The UK vape wind down distorts part of the emerging segment, and some site level moves are stronger than others. Still, the overall setup looks constructive, especially because the strongest signals are once again coming from the markets that matter most.
Below is an overview of how traffic developed across Haypp Group’s main sites during the quarter.

What is happening under the hood
Before diving into the actual findings and my revenue estimates for each segment and for the group as a whole, it is worth briefly explaining what is happening under the hood.
At this point, I am no longer relying on just one forecasting method. I currently run several parallel approaches when estimating Haypp Group’s revenue, and encouragingly, the range between them has become much tighter over time. That is usually a good sign. It suggests that the framework is becoming more coherent and that the underlying signal is being handled in a more disciplined way.
I still run manual Excel based forecasts. That means going site by site, modeling traffic, comparing value per visitor to historical levels, and adjusting the output based on past patterns and my own understanding of the company. This remains useful, especially because manual work forces me to stay close to the business rather than blindly trusting a black box.
At the same time, the framework has evolved quite a bit. Last quarter I introduced several machine learning based models, and for Q1 I have continued improving them further. These models do not just ingest web traffic. They also incorporate extensive backtesting, enough flexibility to detect regime changes, and, increasingly, a more semantic layer that can pick up on major business events that pure traffic data may miss. A good example this quarter is the UK vape exit, which clearly affects Haypp’s Emerging segment and needs to be accounted for separately rather than treated as normal traffic noise.
It is important to stress that this system is still relatively unproven. The early mapping and backtesting look promising, but the usual risks remain. A more advanced model can improve structure and consistency, but it can also overfit, especially when the historical sample is limited. So while the framework is improving, it should still be viewed as an aid to judgment rather than a replacement for it.
What the market thinks
Before presenting my own results, it is worth looking at outside expectations.
On March 31, I ran a public poll on X asking what readers thought Haypp Group’s Q1 2026 revenue would come in at. Based on the response distribution, the implied expected value was roughly 1 062,5 MSEK, with most votes clustered in the 1 025 to 1 075 MSEK range.
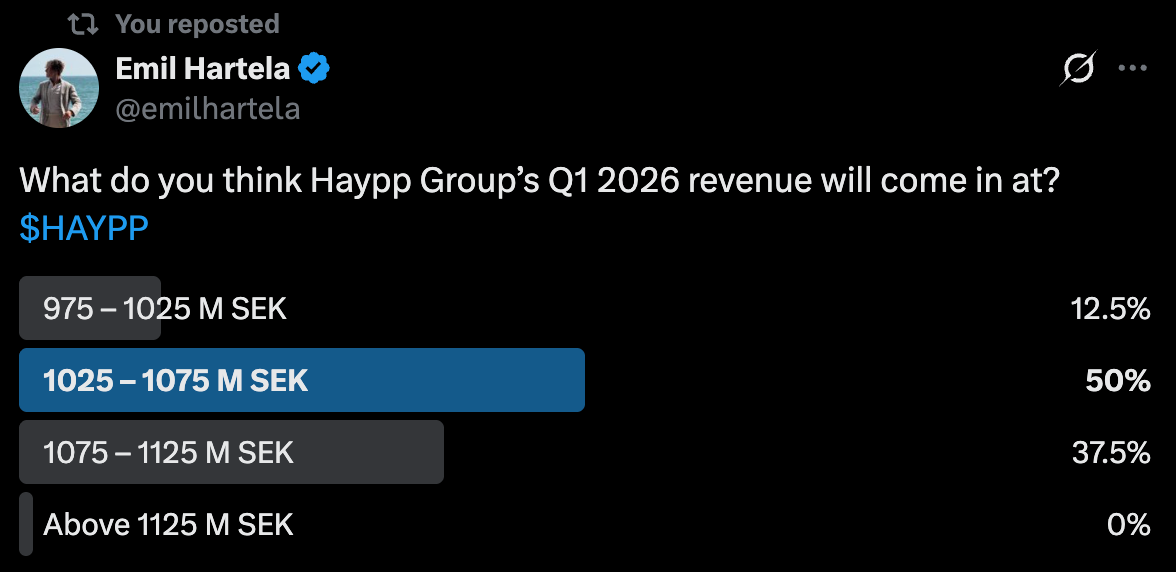
That said, the sample was very small at just eight votes, so this should not be read too aggressively. Chatter around Haypp on X has also been quieter than normal lately, likely reflecting how the nicotine pouch hype has cooled after very elevated valuations across the sector. In many cases, that kind of quieter setup is not a bad sign for future price action.
There also appears to be at least one analyst estimate out there at 1 174 MSEK, although I have not verified whose estimate that is.
As in previous quarters, I still put more weight on the web traffic data than on loose market expectations. In the next section, I compare that market backdrop with the outputs from my own models.
Core market prediction
Starting with the Core segment, the picture remains constructive.
My manual estimate comes in at 755 117 991 SEK, which implies another strong quarter for Haypp’s core business. The main driver here is straightforward: traffic across the key Nordic sites remained strong, with particularly solid performance from Snusbolaget and continued strength across the broader core market footprint. In other words, the traffic backdrop was strong enough to support another robust revenue print even without assuming anything overly heroic on monetisation.
The ML model is somewhat more conservative and points to revenue of around 719,7 MSEK. That is a fairly meaningful gap, but not an especially surprising one. The model tends to be more cautious when traffic strength is unusually pronounced, whereas my manual approach is somewhat more willing to acknowledge that the current operating momentum in the core markets may be stronger than the historical averages would suggest.
For reference, Haypp reported 732 471 557,5 SEK in Core revenue in Q4. That means the ML model is currently implying a slight sequential decline, while my own estimate points to renewed growth. Given the strength seen across the main sites, I lean more toward the latter interpretation, although it is worth noting that the model may still be undershooting rather than outright wrong. We are getting closer to the point where the systematic framework may start doing a better job than my own hand built forecasts, but I do not think this is quite that quarter yet.
Overall, my base case is that Core revenue comes in clearly above the Q4 level, with the manual estimate currently looking like the more realistic read.